Showing posts with label Employment. Show all posts

Friday, September 5, 2014

Has the economy recovered?

Last year I took a look at employment.  I watched the unemployment numbers fall with skepticism, and wondered what was really going on.  Here's a brief recap of that analysis:
I took a look at St. Louis Fed data today, both the civilian employment to population ratio and the working age civilian population.  I then combined the data into a chart of deltas with their initial values pegged to Dec-2007.  The result is the following:


What does this chart mean?  It means that whilethere are about 2.5 million fewer people employed than in 2007, but that we've also got 12.5 million more people of working age - that is, 15 million more unemployed today than we did five and a half years ago.  This is due to an increasing population that has completely given up trying to find work.  It means, that though the recession destroyed something like eight million jobs and the post recession has created around five million jobs, we've added more than twelve million non-working civilians in the same time. 

That's staggering - utterly and completely staggering.  That means - follow me here - that means that not a single working age person added to our population since 2007 is working.  We've added twelve million takers but not one new producer.  Not one.
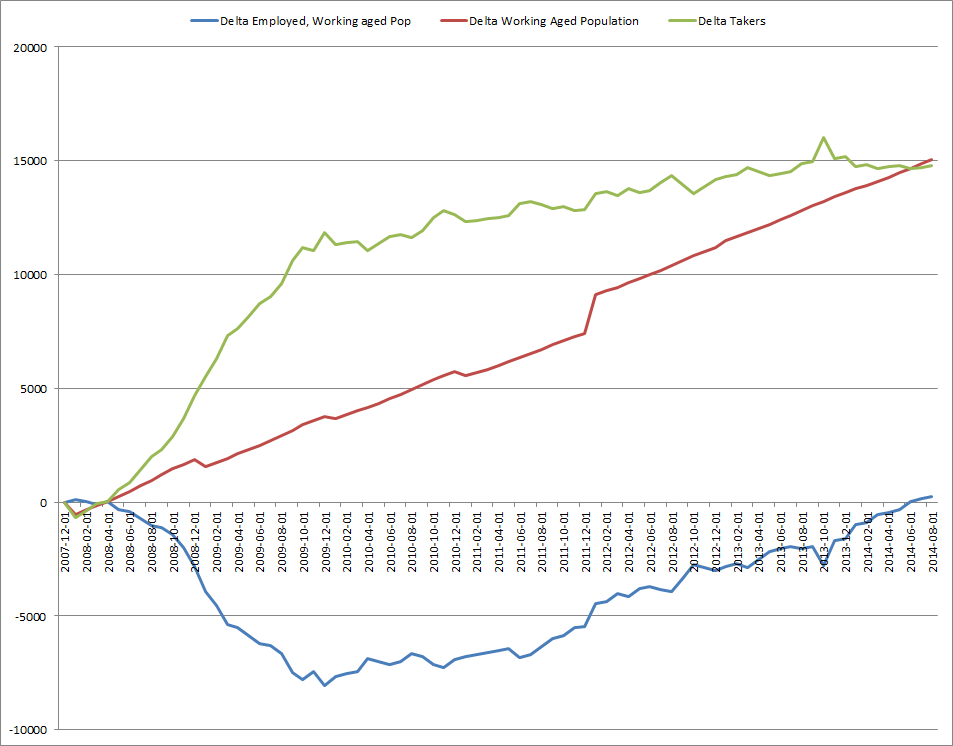
Today I decided to revisit this.  Using the same methodology, but extending out a year further. Take a look at the updated chart.  We can unequivocally say that the number of employed people has improved.  In June, (a year after my previous analysis), we finally caught up to, and passed, Dec-07 employment.  It took 6 and a half years to recover the jobs lost in the recession.


Yet as you know that does not tell the full story, not by a long shot. This simple graph here also shows how many more people have joined us who are of working age, but not working. In fact that number has barely changed at all. 14,800,000 new takers - adults who aren't working but should be.

Here's a chart that shows this.  Virtually unchanged from a year ago. About 4% of the working aged population has simply removed itself from the pool.  BLS verifies this for us again, with 13.5 million more Americans "Not in Labor Pool" now than in 2007.


Where did they go?  Probably to their living rooms, waiting on a government check. The rest of us are, on average, making due with close to 10% lower income and substantially higher than reported inflation. (I like to use a few real items that I purchase, such as chewing gum or fast food.  Prices for Big Macs, for example, have risen about 24% since 2007.) 

More takers, less income, and less for your money. That's the real economic situation. When politicians start to pat themselves on the back over the official inflation rate or employment numbers, keep in mind how far from reality Washington DC is.

Friday, July 4, 2014

The economy has finally recovered all jobs lost during the recession...

Or has it?

True, the number of employed persons is now equal to what it was back when the recession started in 2007, and that is good news, but does that tell us the whole picture?

Take a look at the Civilian Employment to Population ratio.


This graph seems to tell us that the employment situation hasn't improved at all!

What about the loafers?  And I do mean loafers - those who have given up, not those who have successfully retired.


Am I right that 13.5 Million working aged Americans have completely given up looking for work and are living on the dole?  Well, if we assume most true retirees come from a pool of people over 55, we should see a large portion of people over 65 retiring.  Do we?


About half.  So 3 million people who joined the 55-64 age group decided not to work.  If we choose to believe that all of those are happily retired, there are still 10.5 million more people who aren't working.  How many are 65 and over?

From BLS data here and here, we know that we've gained 8.364 million people over 65. We also know that 2.2 million of these people have joined the labor force.  That may mean that the other 6.164 million are happily retired.

It is true that labor force participation rates are growing for the 55 and over crowd - they are the only group that is growing.  So it very well may be true that no one over the age of 54 is discouraged from working, they are happily retired.

We still have 4.336 million people of working age who are considered "long term discouraged" or perhaps disabled, but in any case, not working but not counted as unemployed.

Although I find it personally heartening that most people over 55 who are retiring are probably doing so intentionally, the numbers still mean that in the best scenario, we should add several million to the number of unemployed people. Even so, scenarios are models of reality, not reality itself.  In reality, it doesn't matter if people are happily retired or not.  If they aren't working, they must live off of savings or someone else's labor.

The bottom line is that while we have just returned to the same number of producers that we saw in 2007, those producers have to work harder to take care of those additional 15 million people that have joined the population who aren't able - or willing - to produce.