I took a look at St. Louis Fed data today, both the civilian employment to population ratio and the working age civilian population. I then combined the data into a chart of deltas with their initial values pegged to Dec-2007. The result is the following:Today I decided to revisit this. Using the same methodology, but extending out a year further. Take a look at the updated chart. We can unequivocally say that the number of employed people has improved. In June, (a year after my previous analysis), we finally caught up to, and passed, Dec-07 employment. It took 6 and a half years to recover the jobs lost in the recession.
What does this chart mean? It means that whilethere are about 2.5 million fewer people employed than in 2007, but that we've also got 12.5 million more people of working age - that is, 15 million more unemployed today than we did five and a half years ago. This is due to an increasing population that has completely given up trying to find work. It means, that though the recession destroyed something like eight million jobs and the post recession has created around five million jobs, we've added more than twelve million non-working civilians in the same time.
That's staggering - utterly and completely staggering. That means - follow me here - that means that not a single working age person added to our population since 2007 is working. We've added twelve million takers but not one new producer. Not one.

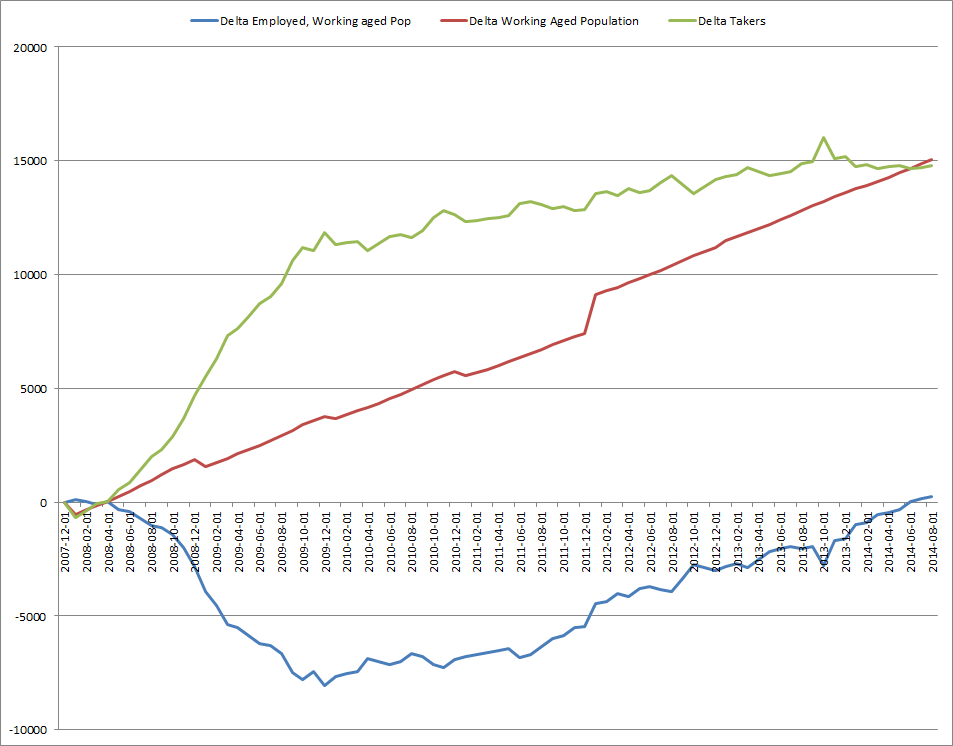
Yet as you know that does not tell the full story, not by a long shot. This simple graph here also shows how many more people have joined us who are of working age, but not working. In fact that number has barely changed at all. 14,800,000 new takers - adults who aren't working but should be.
Here's a chart that shows this. Virtually unchanged from a year ago. About 4% of the working aged population has simply removed itself from the pool. BLS verifies this for us again, with 13.5 million more Americans "Not in Labor Pool" now than in 2007.

More takers, less income, and less for your money. That's the real economic situation. When politicians start to pat themselves on the back over the official inflation rate or employment numbers, keep in mind how far from reality Washington DC is.
No comments:
Post a Comment